Where Canada’s Money Goes: The Great Federal Tug-of-War
In Canada, the flow of money between the people, their provinces, and the federal government is a massive national "circuit" that never truly stops. Every time you buy a coffee in Halifax, earn a paycheck in Toronto, or pump gas in Red Deer, you are fueling a massive national engine.
1. The Collection: How the Federal Pot is Filled
The federal government collects revenue directly from residents and businesses. Based on 2024 Tax Year data, here is the Net Federal Tax contributed by each province:
| Province | Net Federal Tax Contributed (2024) |
|---|---|
| Ontario | $92.4 Billion |
| Quebec | $43.5 Billion |
| British Columbia | $33.0 Billion |
| Alberta | $29.9 Billion |
| Manitoba | $5.7 Billion |
| Saskatchewan | $5.6 Billion |
| Nova Scotia | $4.5 Billion |
| New Brunswick | $3.2 Billion |
| Newfoundland & Labrador | $2.5 Billion |
| Prince Edward Island | $0.7 Billion |
*Tax components: Personal Income Tax (45.9%), Corporate Tax (19.0%), and GST (10.3%).
2. Economic Strength: GDP & Trade Performance (2024)
A province’s tax contribution is linked to its economic output (GDP) and its ability to trade internationally.
| Province | GDP (Million CAD) | Exports (Growth) | Imports (Growth) |
|---|---|---|---|
| Ontario | $1,197,020 | -0.2% | -0.3% |
| Quebec | $616,771 | +1.7% | +1.8% |
| Alberta | $450,000* | +3.0% | +2.2% |
| British Columbia | $412,500* | -0.4% | -1.1% |
| Saskatchewan | $112,839 | +3.0% | +2.1% |
| Manitoba | $85,000* | +1.4% | +0.7% |
*Estimated based on Statistics Canada provincial economic accounts.
3. The "Fairness" Gap: The Net Contributors vs. Recipients
The "Fairness Gap" is the difference between what residents pay in taxes and what the provincial government receives in major transfers (Health, Social, and Equalization).
| Province | Fed Tax Paid (A) | Transfers Received (B) | Net "Left" in Ottawa (A-B) | Equalization |
|---|---|---|---|---|
| Ontario | $92.4 B | $28.7 B | $63.7 Billion | $546 M |
| Quebec | $43.5 B | $29.2 B | $14.3 Billion | $13.6 B |
| B.C. | $33.0 B | $10.0 B | $23.0 Billion | $0 |
| Alberta | $29.9 B | $8.6 B | $21.3 Billion | $0 |
4. Provincial Perspectives: Is it Fair?
- Alberta: Often feels "penalized" for its resource wealth. Because it receives $0 in Equalization but contributes heavily, many Albertans view the system as a wealth transfer to other regions.
- Quebec: Views transfers as a vital part of the Canadian social contract. While it is the largest recipient of Equalization ($13.6B), it is working to grow its economy to eventually become a net contributor.
- Ontario: The "Workhorse" of Canada. It leaves a staggering $63.7B in Ottawa—more than any other province—to fund national interests.
- The Maritimes: Rely on these transfers as a "shrine line" to maintain healthcare services for an aging population and smaller tax base.
- Supporters say it is the "glue" of the country—ensuring a child in rural New Brunswick has the same opportunities as one in Vancouver. They view the system as a form of "national insurance."
- Critics, particularly in the West and parts of Ontario, argue it penalizes economic success. They point out that Alberta, BC, and Saskatchewan receive $0 in Equalization, yet their residents pay the highest per-capita taxes, often creating a feeling of "taxation without equal benefit."
5. The Collection: How the Federal Pot is Filled
The federal government doesn't "bill" provinces directly. Instead, it collects taxes from the individuals and businesses living within them. Because some provinces have more people or higher average salaries, they provide a much larger "share" of the national budget.
Net Federal Tax Contributed (2024 Tax Year)
6. The Redistribution: What Comes Back
Once the money is in the central federal pot, it is sent back out to provinces through Major Transfers to fund the things we use every day—like hospitals, schools, and social safety nets. For the 2025–26 fiscal year, the total "pay back" is scheduled to be $103.8 Billion.
The Three Main Return Channels:
-
Canada Health Transfer (CHT): Distributed equally per person to support healthcare.
-
Canada Social Transfer (CST): Distributed equally per person for education and social programs.
-
Equalization: Distributed only to provinces with lower "fiscal capacity" to ensure comparable service levels across Canada.
7. The "Fairness" Gap: The Big Four Comparison
The real debate isn't about the total amount received, but the net difference—the gap between what a province's citizens pay in and what their provincial government gets back.
Fiscal Gap Analysis (2024–2026 Projections)
Per-Capita Weight: The Individual Burden
When we break it down by person, the "tug-of-war" becomes even more apparent.
8. Deep Analysis: The Economic "Tug-of-War"
The Alberta Paradox
Despite having a much smaller population than Quebec, Alberta leaves $21.3 billion in Ottawa—significantly more per person than any other province. This is largely due to a younger, higher-earning workforce and a massive resource sector. Because the Equalization formula doesn't account for the higher cost of living in these provinces, residents often feel they are being "penalized" for their economic productivity.
The Quebec Balance
Quebec is a unique case. While it is a massive economic contributor, it receives $13.6 billion in Equalization. This narrows its net gap to just $14.3B. Critics in the West argue that this allows Quebec to fund social programs (like subsidized daycare and tuition) that the "contributor" provinces themselves cannot afford.
Where does the "Net Difference" go?
The billions that stay in Ottawa pay for national services that benefit everyone:
-
Old Age Security (OAS): ~$80B+ for senior checks.
-
National Defence: ~$30B+ for the Armed Forces.
-
Federal Debt Interest: ~$54B+ to pay for previous national borrowing.
-
Indigenous Services: ~$30B+ for First Nations and Inuit communities.
9. Opinion & Future Outlook: The Fraying Fabric
Canada’s money management is a delicate balancing act. While it is the "glue" that ensures a child in rural New Brunswick has the same healthcare as one in Vancouver, it is reaching a breaking point.
The Affect on Canada’s Economy
-
Stifled Investment: When $63.7B leaves Ontario's economy, that is capital not being spent on local housing or transit. Over time, this can slow down the "lead horses" of the national economy.
-
Provincial Assertiveness: We are seeing a rise in "fiscal defiance," such as Alberta’s Sovereignty Act or Saskatchewan’s carbon tax battles. If the net contributors feel they are "Ottawa's ATM" without a seat at the table, national unity weakens.
-
The Aging Crisis: As the population ages, the demand for health transfers will explode. Lower-income provinces with older demographics will require more money from a shrinking pool of younger workers in high-income provinces.
Share This
Latest Blog
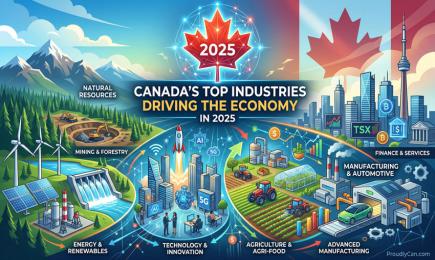
Top Canadian Industries Driving the Economy in 2025
Which industries are driving Canada’s economy in 2025
04 April 2026


Why Buying Canadian Products Matters More Than Ever
27 February 2025
The Importance of Online Appointment Booking Apps for Businesses
23 November 2024
Boosting Canada's Economy: 5 Reasons to Buy Local Goods
12 August 2023